

A MESSAGE FROM ZANZULU -
STAY AT HOME!
Chitrak Bhowmik,
Gokul Madhav,
Hardik Khurana
During the Plague of 1636, John Graunt created a chart plotting mortality and survivorship of the population due to the pandemic. Statistical records of diseases were maintained and analyzed afterwards. William Farr used statistical data to test social hypotheses; he classified causes of death, discovered a relationship between population density and mortality rate. John Snow (yes you read it right) was the first person to count and map cases geographically; he discovered that a hand pump in Broad Street was the source of the 1854 Cholera Outbreak in London. In 1760, Daniel Bernoulli created a mathematical model to defend the practice of inoculating smallpox. During early 20th century Ronald Ross, William Hammer and others developed a mathematical model called SIR (Susceptible-Infected-Recovered) Model, which still finds applications in charting disease spread.
So why did we bombard you with so many historical cases where people have tried to quantify the disease spread ? Because bringing numbers to the game makes it a scientific discipline . These ‘mathematical models’ have become more powerful and can make some really amazing predictions.
Let us look further .
WHAT IS A MODEL?
|Mathematical models allow scientists to predict the spreading of an infectious disease and the likely outcomes of the epidemic. Models use basic assumptions, statistical data and mathematics to quantify parameters and use those parameters to predict the effect of different interventions like vaccination, social distancing and use of hand sanitizers.
HOW TO COMMUNICATE A MODEL?
Data visualization is positively affecting the public’s understanding of the pandemic. Most of you reading this are familiar with the plots showing the exponential spread of the disease. Plots have become a very important tool in public awareness as it allows people from non-technical backgrounds to understand relatively difficult concepts.
SIR MODEL
We are going to introduce a very simple model, actually the simplest one there is, to drive home the ideas introduced and to work with actual numbers. Here it is SIR! Not much we can agree but wait…. this model has immense power to give us a broad overview of the dynamics of the disease. Before the equations are introduced, let us first look at the assumptions considered. Assumptions make it easy to do the computations while still getting some insights into the spread of the disease.
1. The size of the population is constant.
2. The population is large as well as closed, i.e. Neither can an individual escape from the population nor is an outsider allowed to join it.
3. No natural births and deaths occur.
4. A diseased person is capable of spreading the disease with the instant one is infected. (In the real world, there is a period of latency.)
5. The population is homogeneously mixed i.e. an infected person comes in contact with every other individual with equal probability per unit time.
6. A recovered person cannot get the disease again.
Armed with the assumptions let’s dive down into the equations.
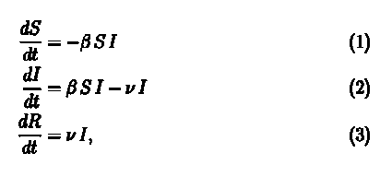
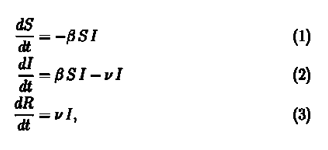
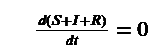
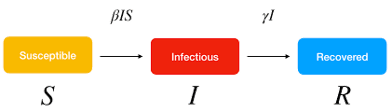
SIR Model is part of a group of models used in epidemiology to study infectious diseases which are known as compartmental models. As the name suggests there are compartments (Duh!) in which the population is divided into at any time t. For our model these compartments are Susceptible [S(t)], Infected [I(t)] and Recovered [R(t)]. As the disease proceeds, we move people from one compartment to another based on some rules. The rules are provided by these set of equations.
We will check the consistency of the equations first.
If you remember one of our assumptions was that the total population be constant. So, if you add equation 1, 2 & 3 you will find out all elements on the right side cancel out to zero and we get,
We had considered the total population to be constant (S(t)+I(t)+R(t)=N) at all times, therefore, the above equation checks out.
Let us tackle equation 1 first. On first glance we notice that the rate of change is negative, which means that the number of susceptible people is decreasing. This is quite apparent since as time goes on the number of susceptible people decrease as more and more people get infected. But it is not apparent why the rate is -βSI. This follows from our assumption that our population is homogeneously mixed. Let us consider that one infected person further infects b number of people per day. But all of these people are not susceptible. Fraction of susceptible people in the population are S(t)/N.
Therefore, if our assumption of homogeneous mixing holds, an infected person on average further infects b*S(t)/N people every day. Therefore total number of infected people per day becomes I(t)*S(t)*(b/N) where β= b/N .The number of people that get infected per day are removed from the susceptible population which gives us the negative sign .
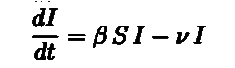
The above arguments lead us directly to equation 2. Equation 2 deals with the infected population. We need to account for the people who get recovered. The recovered people will be removed from the infected population and added to the recovered population. If we consider ν to be the fraction of the infected population that are recovered per day we get νI(t) to be the number of recovered people per day. Subtract it from the number of infected people per day and Voila! we get our second equation. We also get equation (3) as the recovered people we had removed from the infected population itself constitute the recovered population. If you look carefully the number of recovered people increases with time.
Now that we are comfortable with the equations, we are going to answer some real questions that a government has to decide during the spread.
The first question that comes to our mind is “will the disease spread”?
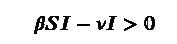
Before declaring a pandemic and introducing lockdown procedures one must be sure that the disease is actually spreading. Based on our model we must look into equation 2.
The disease spreads if the rate is positive that means
which gives us β/ν>1/S, implying R=b/ν >N/S. For a large population we can approximate N/S ~ 1. R is the contact ratio or reproduction number we all have heard about a lot in COVID-19 articles. If this R >1 the infection spreads. But does it spread indefinitely? NO! If we look closely the equation also tells the existence of a non-zero critical point, which means after a point the number of infected people starts to decrease!
With that statement we state our second question “How many at most?” This question has immense practical significance as medical facilities are not infinite, especially in a third world country like India. We need to ascertain whether the medical system in place can handle the number of patients the disease throws at them.
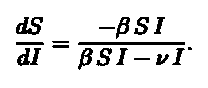
To calculate, we divide Equation 1 by Equation 2 obtaining;
Separating variables and integrating we will get I(t). We plug in the conditions for
I max which is when dI/dt=0 implying S=ν/β and obtain,
According to Weiss (2013)
“We stress that the existence of a threshold for infection is far from obvious and was missed by many public health and infectious disease experts. The reason is that such a threshold cannot be discerned from data; it requires a mathematical model to illuminate.”
REPUBLIC OF ZANZULU
Since we know how the model works, now we see it in action. First, we set up our population. Mind we always have the assumptions that we discussed about.
Land: Zanzulu (An imaginary world)
Population:1000
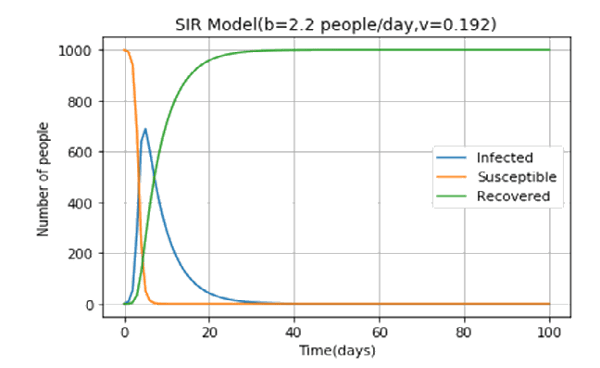
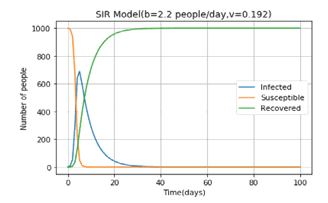
One day the Zanzulu hospital came across an ill person. On testing they find out that man had an exotic disease which was not encountered in the land of Zanzulu (He came back from somewhere outside the island). On conferring with scientists abroad they came to know about the disease. This extremely contagious disease had a high contact ratio (>1). The Zanzullian epidemiologists, using a basic SIR model, came up with the following predictions.
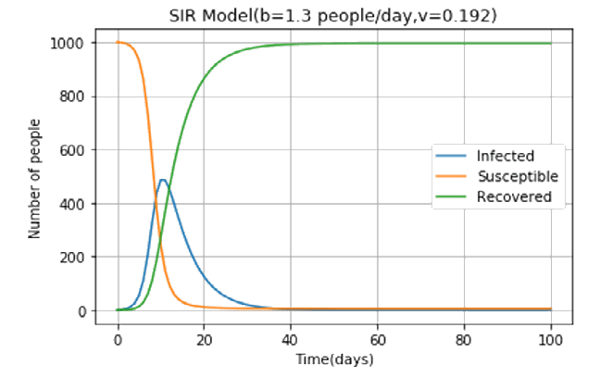
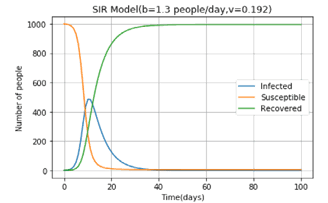
The Zanzulu government in a bid to “flatten the curve” imposed a strict lockdown regime which reduced b to 1.3 people/day. The epidemiologists went to work again. Here’s what they found out. The peak number of infected people has gone down from over 600 to around 500! If Zanzulu has provisions for 600 beds, after imposing lockdown they can provide treatment to everyone. The effectiveness of the lockdown extends down to the very real COVID-19 pandemic that is wreaking havoc all over the world.
MODIFICATION OF SIR
There are many things the basic SIR model has taught us. However, the real world is far more complex than the world described in the model. More sophisticated models can be built by modifying the assumptions of the SIR model.
Listed below are a few modifications the authors considered and with them a qualitative description of how to incorporate these changes in the model.
1. AIRBORNE PATHOGEN: One of the assumptions of the model is that transmission happens by physical contact between an infected and a susceptible individual. However, that may not satisfy a scenario with an airborne pathogen, for instance. To incorporate such a scenario using the equations of the current model, we can modify the transmissibility factor to be a monotonic function of the rate of new infections. As more people get infected, the concentration of the pathogen in the environment will increase faster than the rate at which the pathogen naturally degrades.
2. DYNAMIC VARIABLES: The current model does not incorporate natural births and deaths. This can easily be rectified by adding variables accounting for the natural birth rate and death rate into equation 1.
3. LIFETIME IMMUNITY: The model assumes that the recovered individual becomes immune to the pathogen for the lifetime. However, that need not be the case for many diseases. A new SIRS model introduces a variable that accounts for the rate at which individuals lose immunity and adds/subtracts that number from the susceptible/ recovered population.
4. ZERO LATENT PERIOD: The model assumes that an individual from the susceptible population instantly becomes infectious upon contact with an infected individual. To incorporate a non-zero latent period, we can define a fourth group of individuals, as done in the SEIR model. The susceptible individuals upon contact with an infected individual first move to the exposed group and then to the infected group. The rate of increase of infections is now characterized by an incubation rate, rate at which individuals move from the exposed group to the infected group, and recovery rate.
5. FREE MIXING OF INFECTED AND SUSCEPTIBLE POPULATIONS: The model assumes that the infected and susceptible populations mix freely. However, infected individuals develop symptoms and are admitted into care; they do not interact with the susceptible population. The authors propose the creation of a new compartment that consists of all the people who are hospitalized and do not take part in the spreading of the disease . Two variables would be sufficient to parametrize this, one to quantify the fraction of the infected individuals that develop symptoms and the other to describe the rate at which the symptomatic individuals are admitted into care.
We have learnt about the simplest epidemiological model there is and watched how it prevented a great catastrophe in the land of Zanzulu. Be it the fictitious Republic of Zanzulu or our very own India, the effectiveness of the lockdown procedures is undeniable.
We should be concerned upon seeing the plots below. The number of both infected and dead people are rising exponentially. Social distancing is the key to prevent further strain on the healthcare facilities .Therefore the authors implore you to stay in your homes and to use proper protection when outside .
REFERENCES
[1] Brauer, F. (2017). Mathematical epidemiology: Past, present, and future. Infectious Disease Modelling, 2(2), 113–127. https://doi. org/10.1016/j.idm.2017.02.001
[2] Dong, E., Du, H., & Gardner, L. (2020). COVID-19 in real time. The Lancet Infectious Diseases, 20(5), 533–534. https://doi. org/10.1016/S1473-3099(20)30120-1
[3] Healy, K. (2019). Data Visualization.
[4] Kapoor, G., Sriram, A., & Joshi, J. (2020). COVID-19 in India: State-wise estimates of current hospital beds, intensive care unit (ICU) beds and ventilators, (April).
[5]Vega,D.(2020).Lockdown, one,two, none, or smart. Modeling containing covid-19infection. A conceptual model.https://doi. org/10.1016/j.scitotenv.2020.138917
[6] Weiss, H. H. (2013). The SIR model and the Foundations of Public Health, (3).
Website Designed By- Tech Team Episteme
©️Episteme Science Magazine 2022